This guide walks through ADVX Logger in fourteen steps, in the order you will meet them. Every screenshot shows the app running with no hardware attached, which is how most of it works.
This guide is for the new ADX Logger (for BDX and NxG Devices Only)
Download link for ADX Logger: Click Here
If you have an X4 or LWTS+ device please use LiveLink 2 instead.
Download link for Live Link 2: Click Here
Before you start
ADVX Logger does three jobs: it builds the DLX/DLOG parameter list that your device records, it opens and analyses datalogs, and it carries reference tables for trouble codes, ECU source values and unit conversions.
You can do a lot with no hardware attached. Anything that talks to the car is greyed out until a device is connected, so check the status bar at the bottom first to verify the connection.
| Works with no device | Needs a device or vehicle |
|---|---|
| Open a datalog, playback, chart analysis | Live datalog |
| Compare two datalogs | Import a datalog off the device |
| Build and edit a DLX or DLOG file | Upload a DLX/DLOG to the device |
| DTC lookup, Source Values, Unit Conversion | Read or clear the vehicle’s trouble codes |
Tip: Datalogs are plain CSV files. The file picker says All files, so point it at the .csv you want.
1. First launch
A panel appears in the top-right corner before you have touched anything.
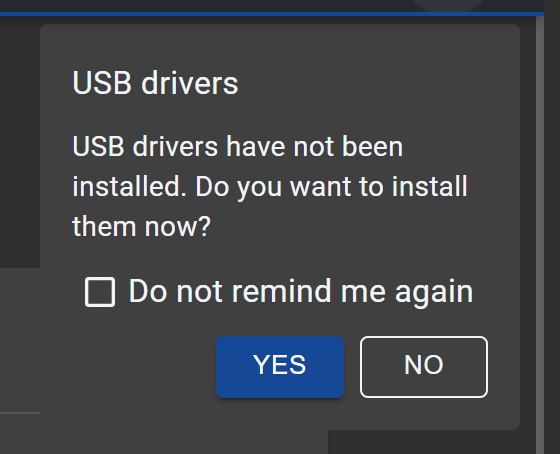 The USB drivers prompt
- YES installs the USB drivers that ship with the app. This is the right answer if a device will ever be plugged into this PC.
- NO dismisses the prompt for this session only.
- Tick Do not remind me again and it stops asking for good. You can bring it back under Settings → Device → Offer the USB drivers at startup, and the Updates section can install the drivers later at any time.
2. Home tells you what is connected
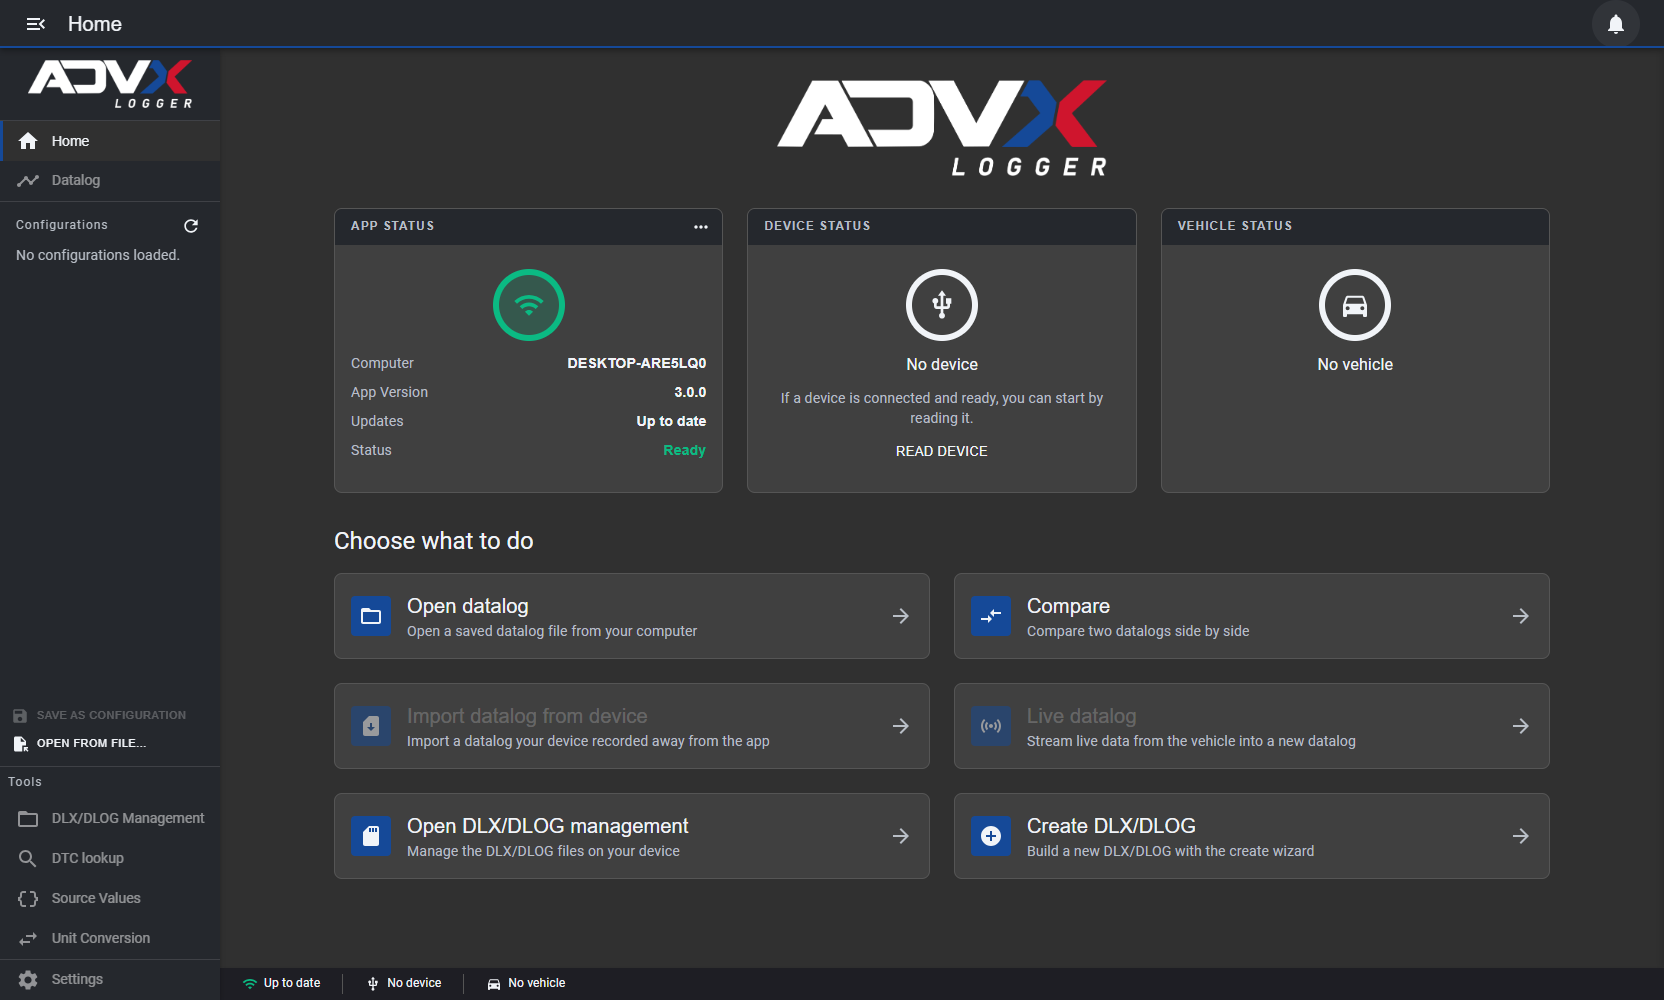 The Home page
Three status cards show the app’s own version and update state, the device, and the identified vehicle. With nothing plugged in they read No device and No vehicle. The same three indicators repeat along the bottom bar, where Up to date, No device and No vehicle are clickable (Check for updates, Read device and Refresh vehicle info).
READ DEVICE on the middle card is the fastest way to pull the vehicle’s details once something is connected. Below the cards sit six shortcuts (Open datalog, Compare, Import datalog from device, Live datalog, Open DLX/DLOG management and Create DLX/DLOG), which between them cover almost everything in this guide.
3. The menu lives in the left rail
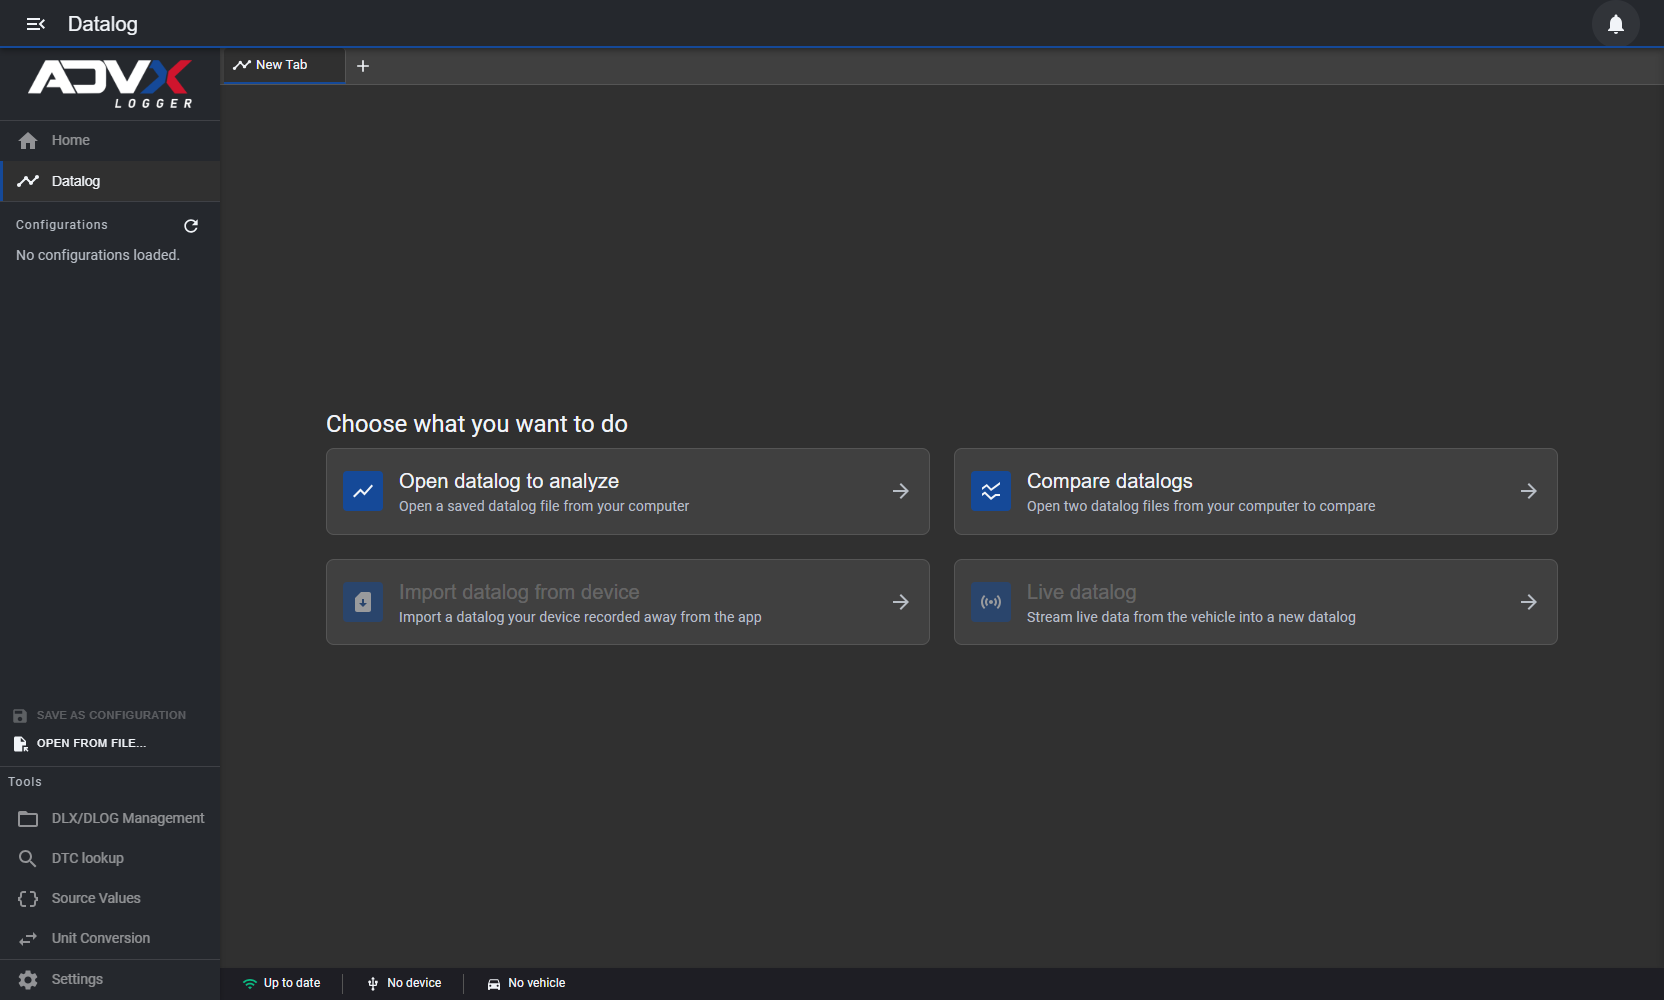 The rail expanded, on an empty Datalog tab
Click the ☰ (menu) icon at the top left to expand the rail. Do this on day one: when collapsed, the rail hides the Configurations section completely, and that is where saved layouts live.
This is also the empty Datalog tab. There are four things you can do here, and the two that need hardware are greyed out until a device is connected:
| Card | Needs a device? |
|---|---|
| Open datalog to analyze | No |
| Compare datalogs | No |
| Import datalog from device | Yes |
| Live datalog | Yes |
4. A datalog, opened
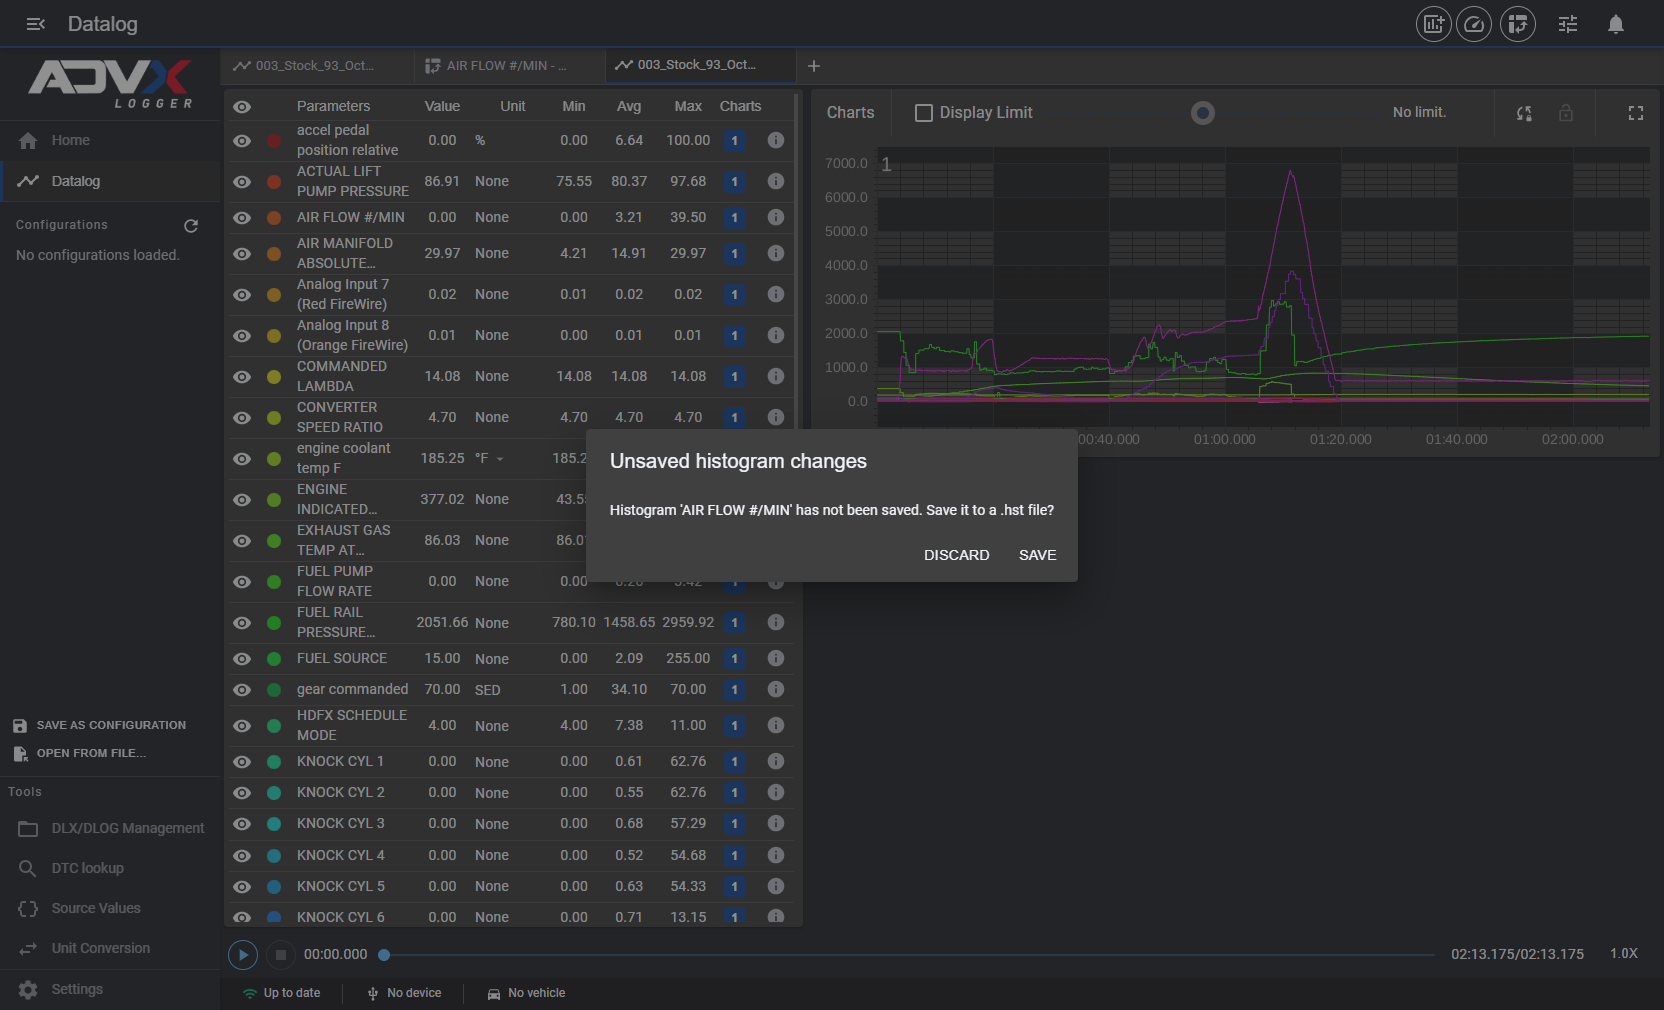 The analysis workspace
Pick a .csv and the tab fills with three things.
- Parameters, down the left, lists every channel in the log: live Value, Unit, and Min / Avg / Max across the whole run. The eye icon hides a channel from the charts, the colored dot is its trace color, Charts says which chart it is drawn on, and ⓘ reports its PID type and module.
- Charts hold the traces over time. Display Limit narrows the visible window. The two icons to its right sync the time axis and lock zoom across charts, and the last one expands the charts to fill the window.
- The play bar runs along the bottom.
The + on the tab strip opens a second log beside this one, and tabs survive a restart.
5. Play it back
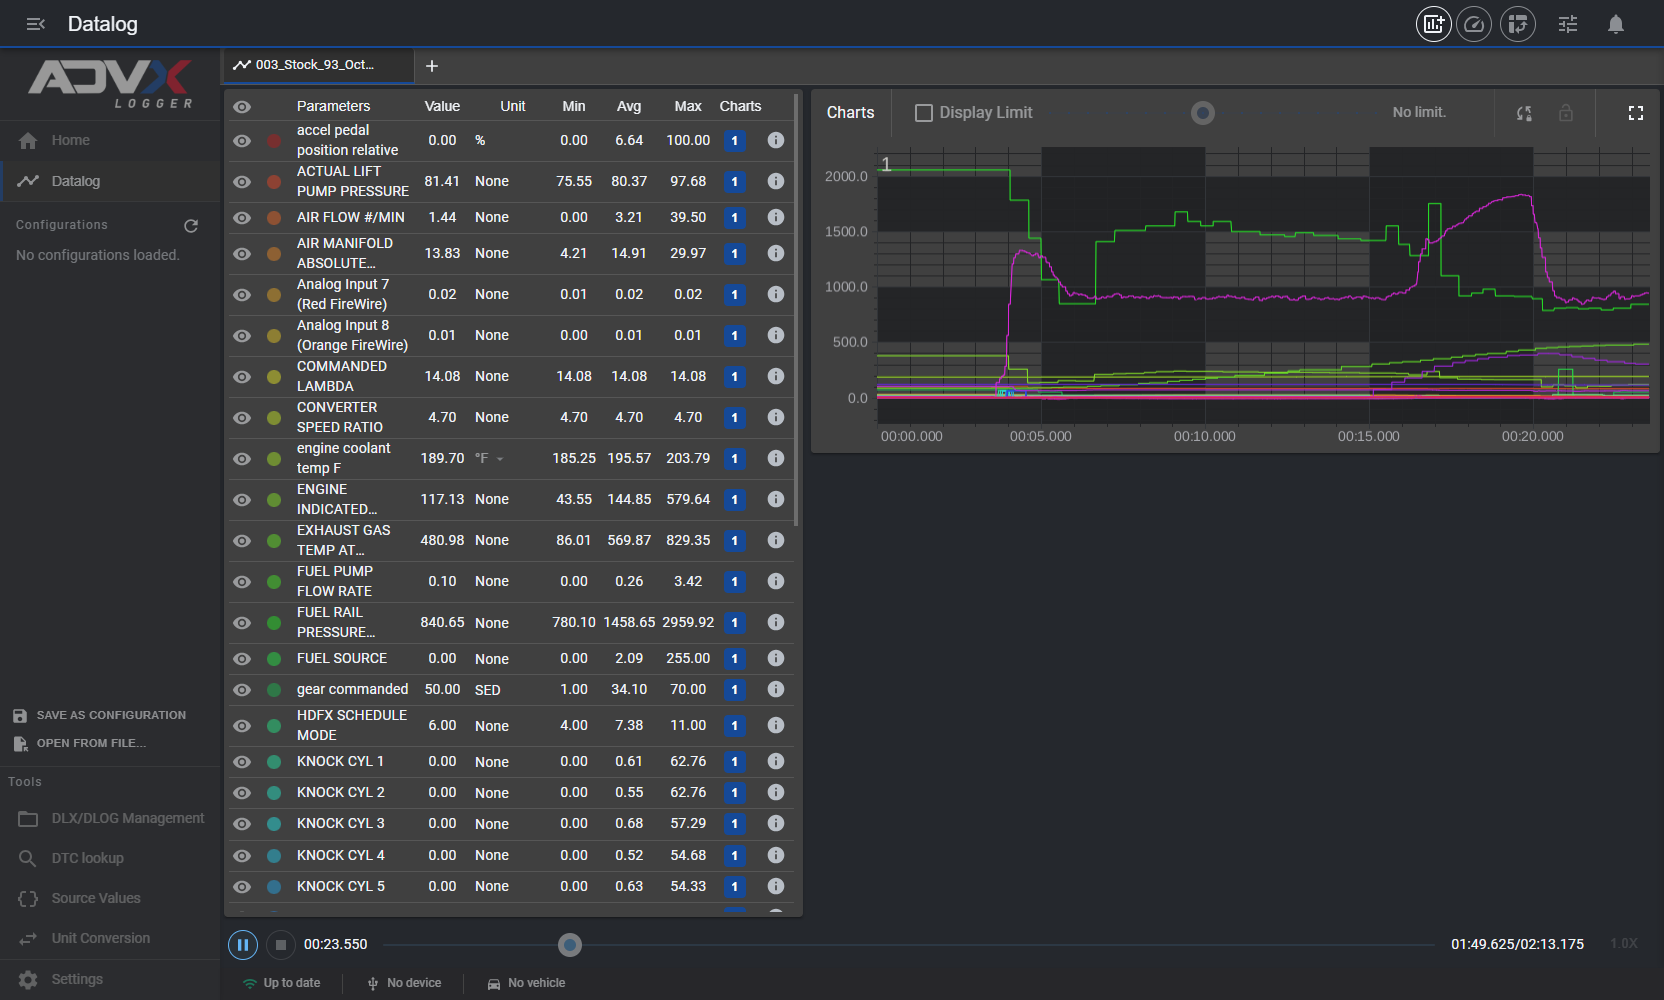 Mid-playback
▶ plays the log in real time and the Value column tracks the play head, so you can watch a pull develop channel by channel. ■ resets to the start.
Worth knowing: while playing, the charts and any histogram only show data up to the play head. Stop, and the whole run comes back. Nothing has been lost.
6. Build a histogram
This is the one screen where first-time users reliably get stuck, so it gets two pictures.
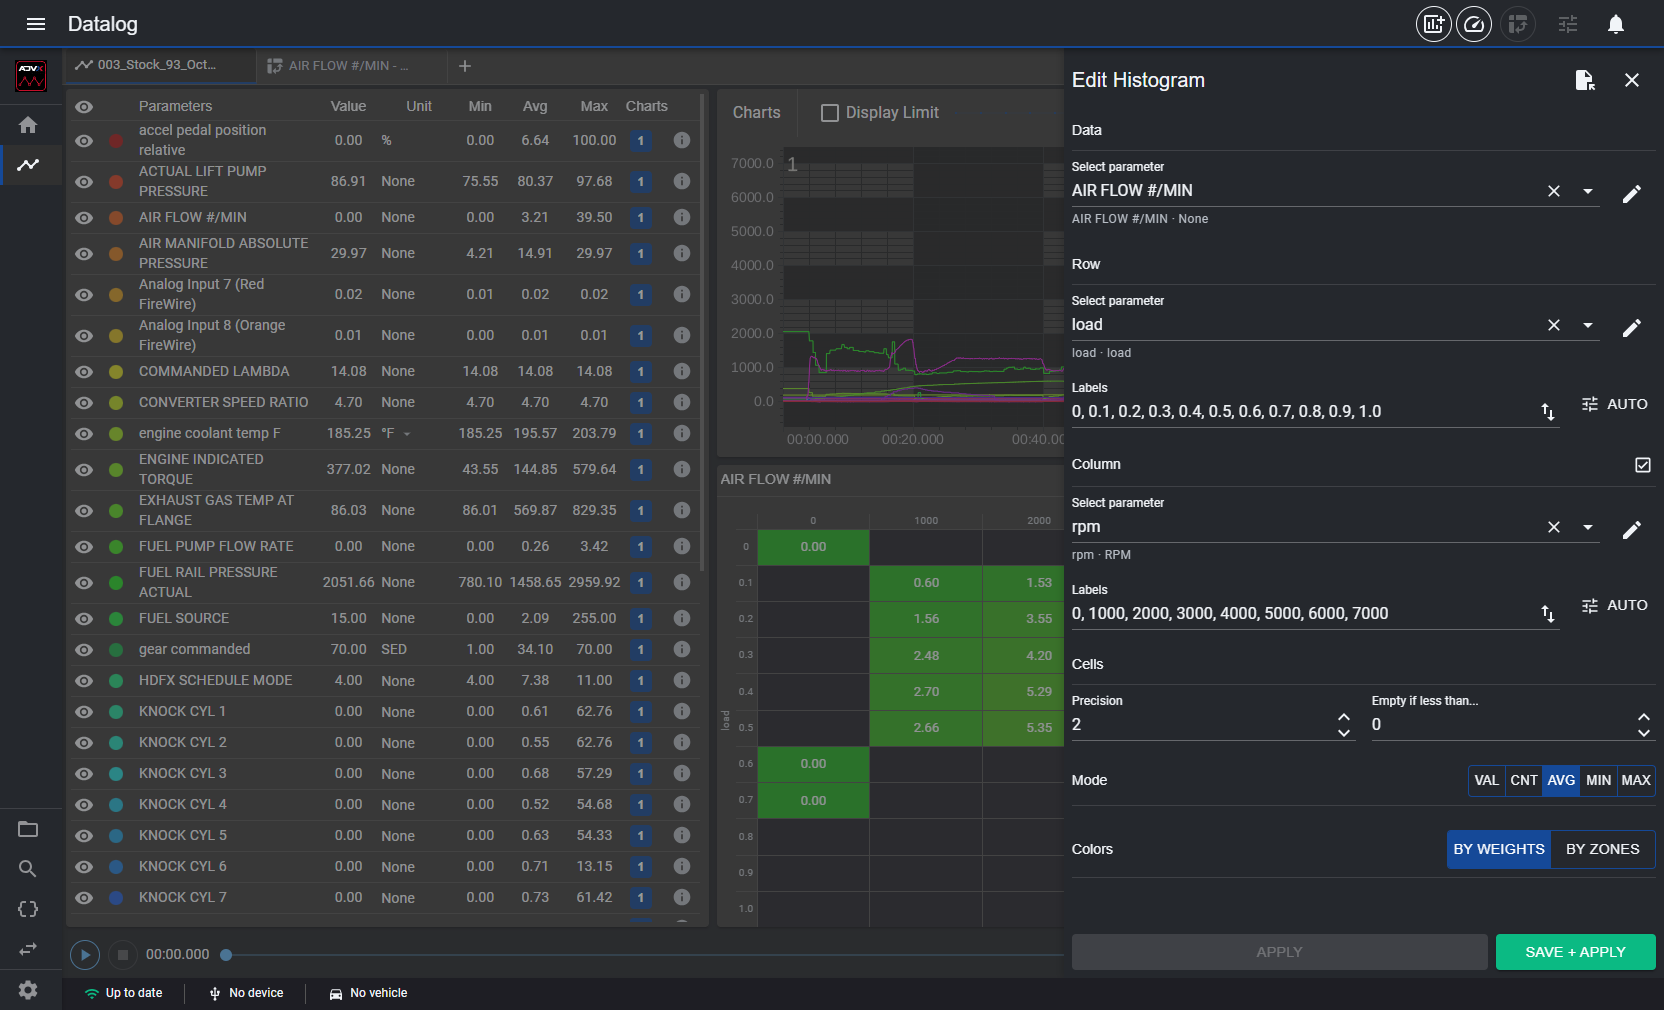 The histogram form, filled in for an rpm × load map
Click the Add Histogram icon at the top right, next to the notification bell. When you are done, Apply and SAVE + Apply are at the bottom of the form.
- Data: the channel being measured, here AIR FLOW #/MIN.
- Row: the first axis, here load.
- Labels: the bin edges, comma-separated. Type them yourself, or use AUTO (see below).
- Column: the heading stays dimmed until you switch it on with the small square box at the right-hand end of its row. Press it and a second parameter field and a second Labels field appear.
- Mode: AVG is the usual choice. CNT counts samples; MIN, MAX and VAL do what they say. Colors shades cells BY WEIGHTS (relative to the data) or BY ZONES.
ADD greyed out? The AUTO button beside Labels fills the bin edges in automatically, and ADD stays greyed out until Labels has something in it. If ADD looks permanently disabled, the empty Labels field is why.
Pick edges that actually span your data. If rpm reaches 7000 and your edges stop at 9, every sample lands in the first bin and the map looks empty with one value in a corner.
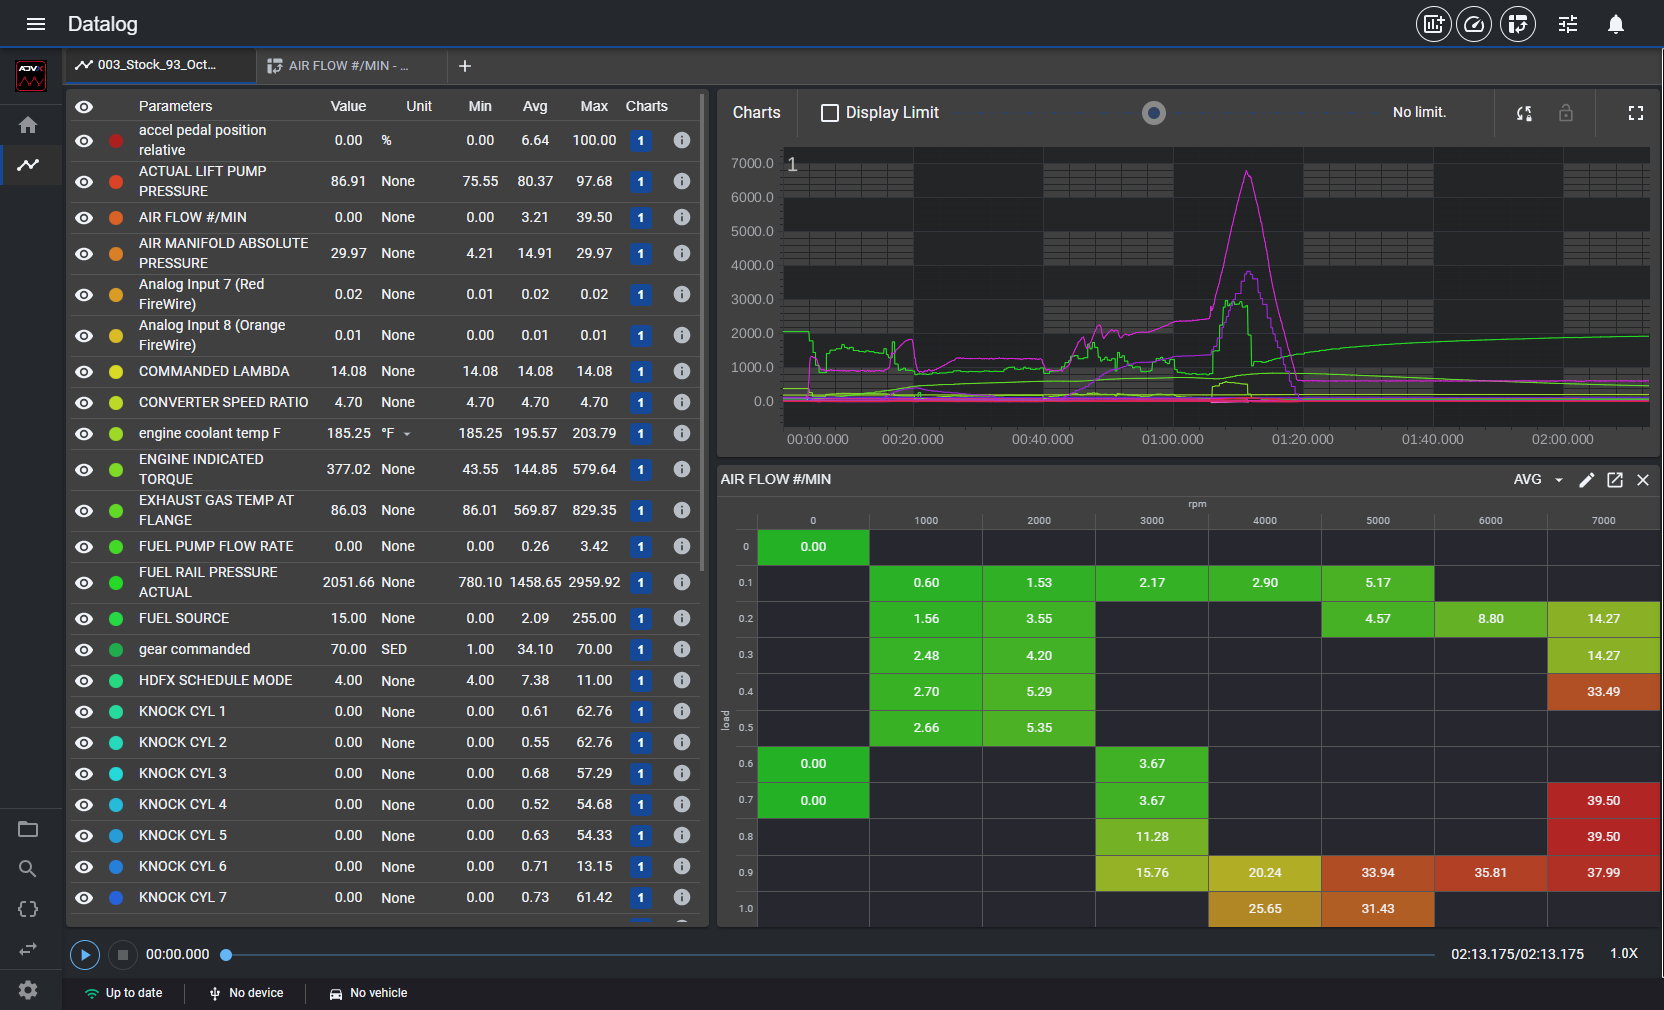 The finished map
New tiles arrive small (10 × 10 of the 64 × 36 grid, about a sixth of the width shown above). Drag the bottom-right corner out to resize; the handle only appears while the pointer is over the tile.
The tile’s header carries:
- the mode selector (AVG), which switches between VAL, CNT, AVG, MIN and MAX without reopening the form;
- a pencil that reopens the form;
- open in new tab, which opens the histogram in its own tab at the top;
- a ✕ that removes the tile.
7. Compare two datalogs
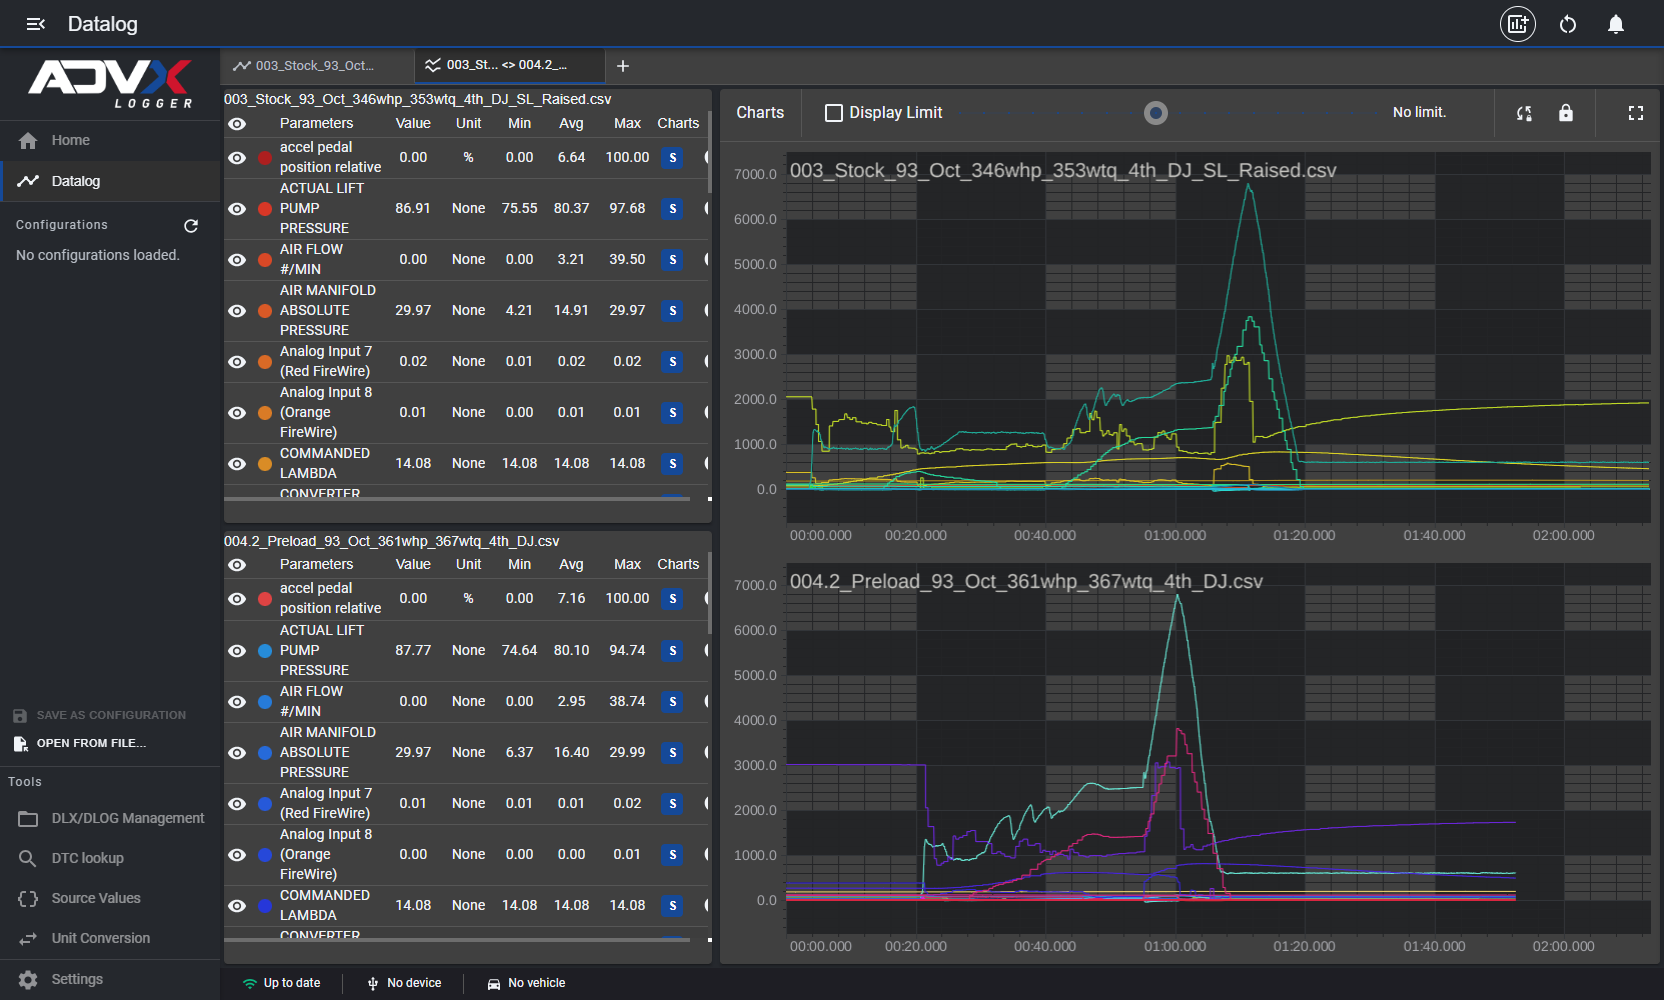 Two logs side by side
From an empty tab choose Compare datalogs, click the browse icon at the right-hand end of each row (top row is file one, bottom row is file two), then click Compare →.
You get one Parameters panel per log, color-coded, over charts that share a single time axis. Min / Avg / Max sitting side by side is usually the quickest way to see what changed between two pulls.
- The Lock icon at the top right of the charts locks or unlocks the charts from each other.
- The Add chart icon at the top, next to the notification bell, adds more charts to your view. Use the chart selector in the parameter list to choose which chart each parameter appears on; you can overlay parameters from both logs in an added chart.
8. Create a DLX or DLOG: step 1
A DLX or DLOG is the list of parameters your device will record.
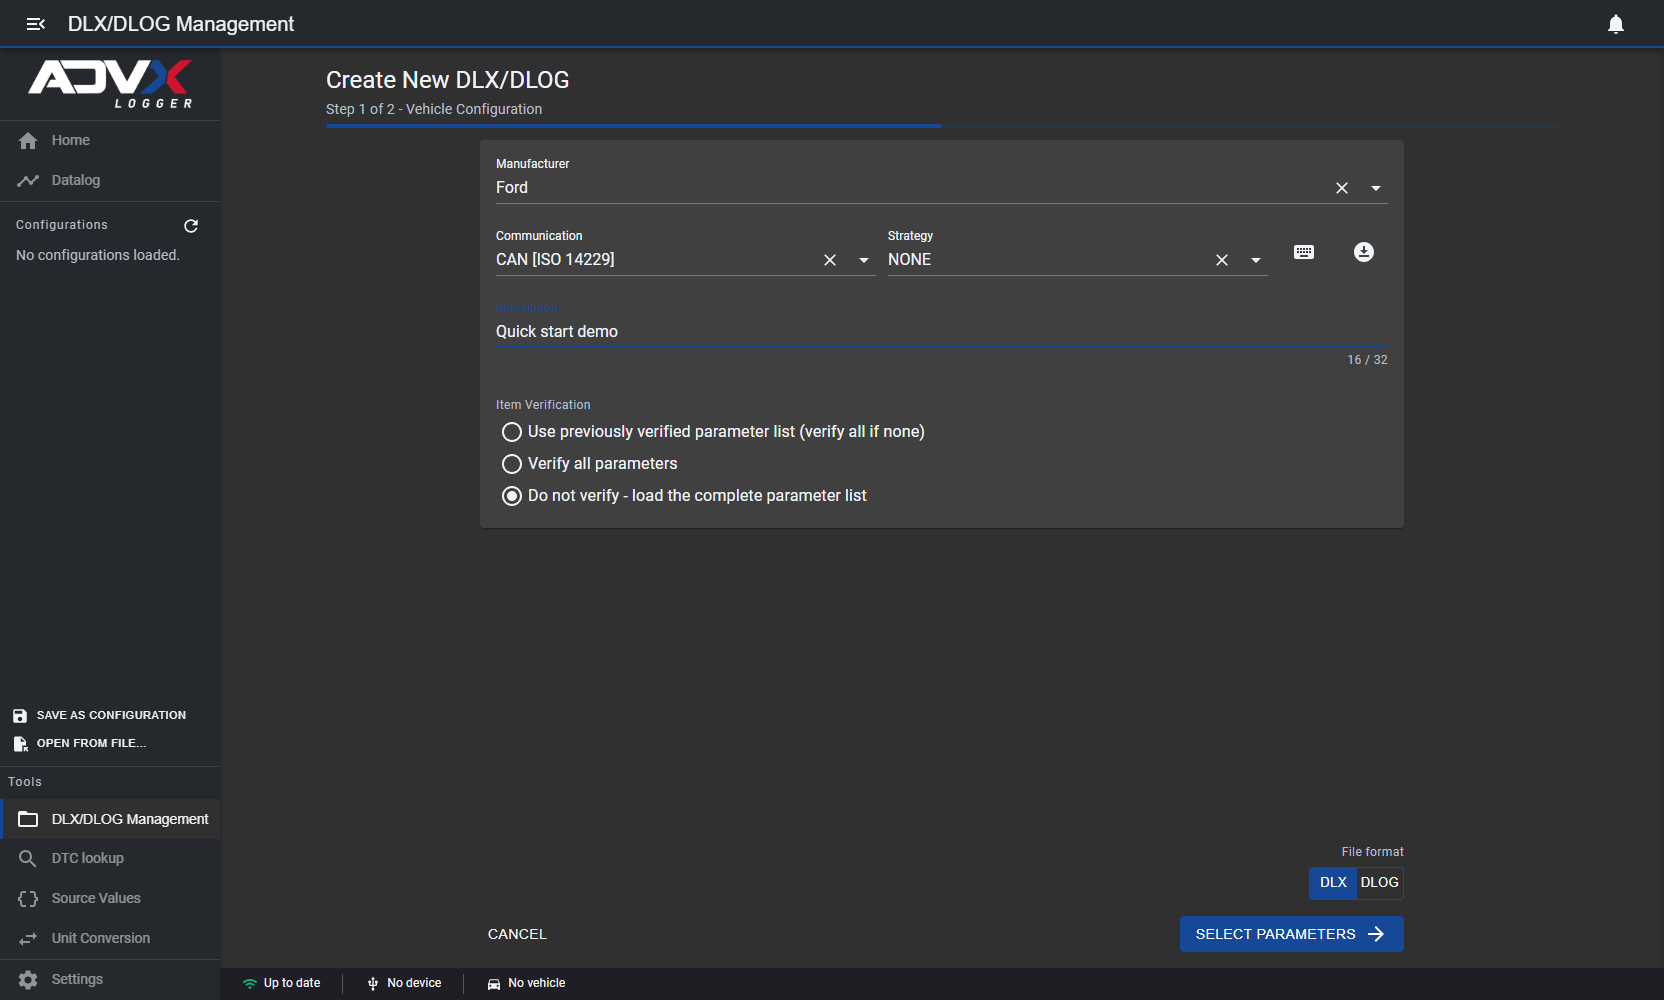 Step 1, filled in
- Pick Manufacturer, then Communication; the protocol list narrows to that manufacturer.
- Strategy comes from the definition database. Leave it empty for a manual strategy and it resolves to NONE. With a vehicle connected, the blue download icon to the right of Strategy fills all three fields for you.
- Type a Description. The SELECT PARAMETERS button stays greyed out until you do.
- Choose Use previously verified parameters list, Verify all parameters, or Do not verify.
- Under File format (bottom right, above Select Parameters), choose DLX (Legacy devices) or DLOG (NXG/PXP devices). DLX is selected by default if no vehicle connection is established.
- Click Select Parameters to move on to the parameter list.
9. Create a DLX or DLOG: step 2
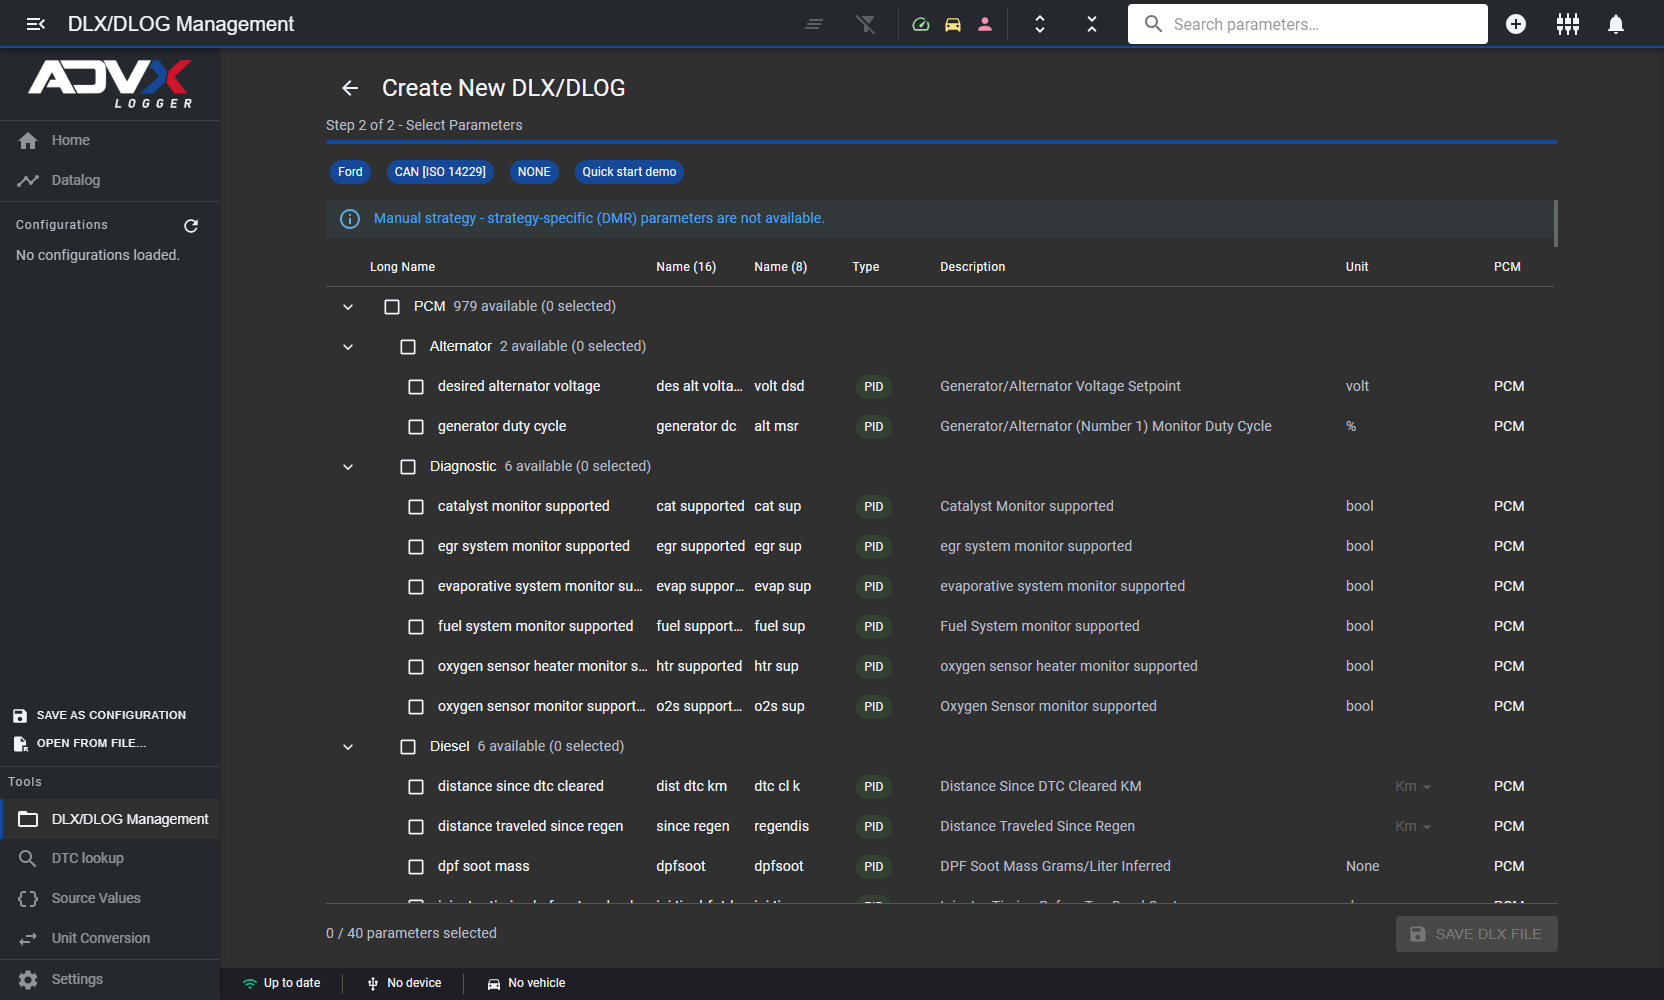 Step 2, the parameter tree
The parameters are shown as a tree of module → category → parameter (979 of them on this Strategy). Tick what you want; the counters roll up as you go and the footer tracks n / 40 parameters selected. 40 is a device limit.
Search matches the long name, both short names and the description, so “rpm” also finds channels that merely mention it. Set each row’s display Unit here if it offers a choice.
The toolbar filters the tree: Show PID, Show OBD, Show User Defined, plus Clear selection, Show selected only, and expand/collapse all. Two extras live here as well:
- Add parameter defines a user PID.
- Add analog input configures the eight analog channels from 15 ready-made sensor presets.
Save DLX File or Save DLOG File prompts you to save the file to a location on your computer.
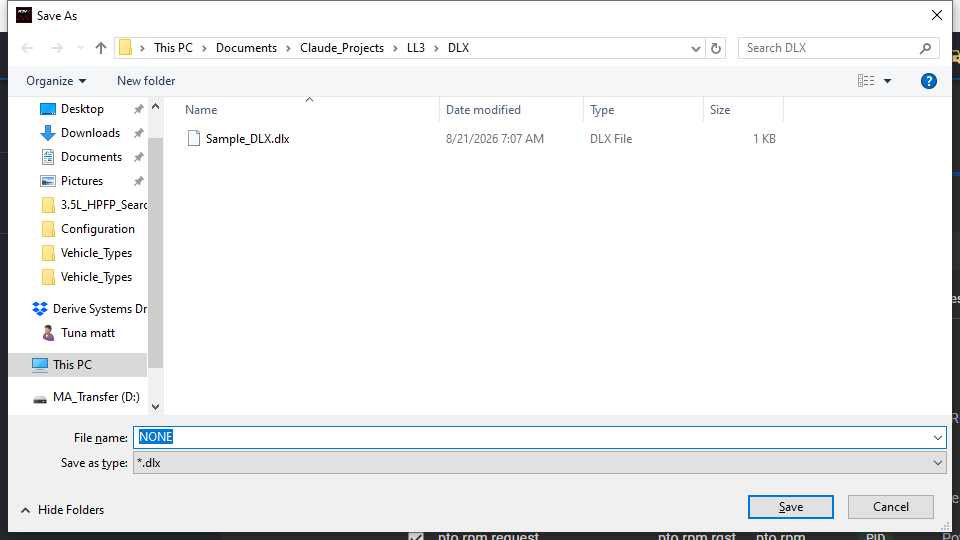 Saving the file
Tip: The file is named after the strategy by default, so a manual strategy gives you NONE.dlx. Rename it to something you will recognize in six months.
10. Your files, afterwards
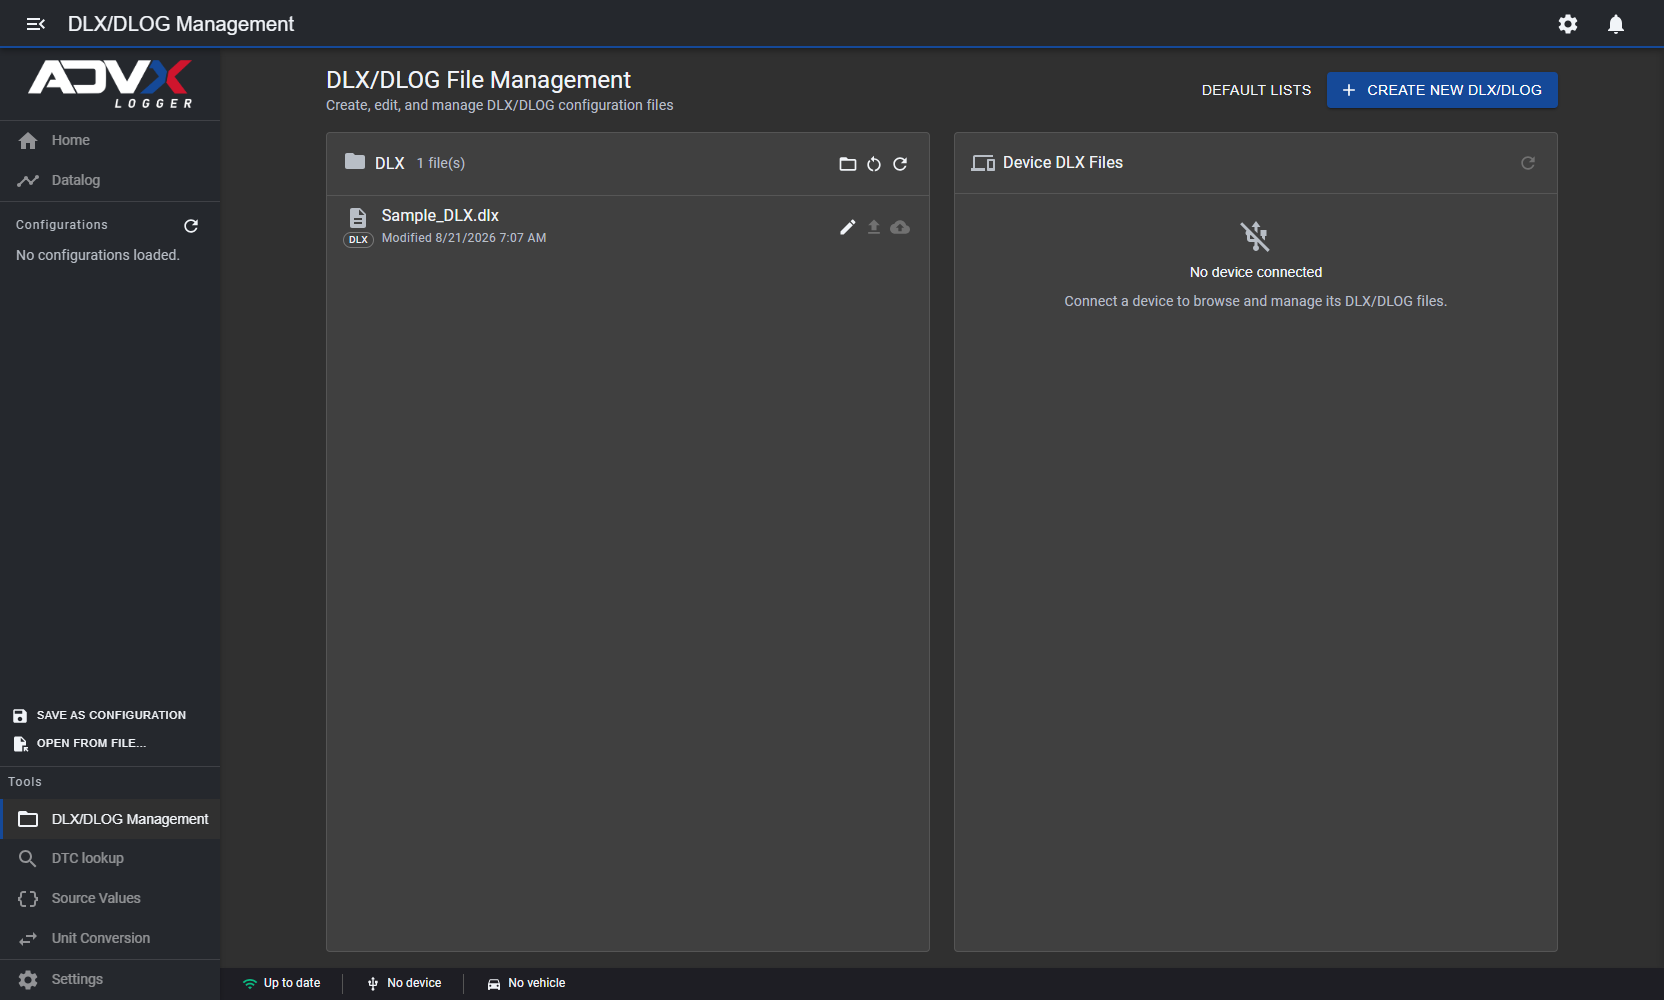 DLX/DLOG Management
This page lists every DLX and DLOG in your DLX/DLOG folder, with the date each was last modified. Each row has three actions: Edit, Upload to device and Upload to cloud.
The gear icon sets the DLX folder itself. If the list says Folder not found, the default %USER%/Documents/DLX simply does not exist yet; point it somewhere real.
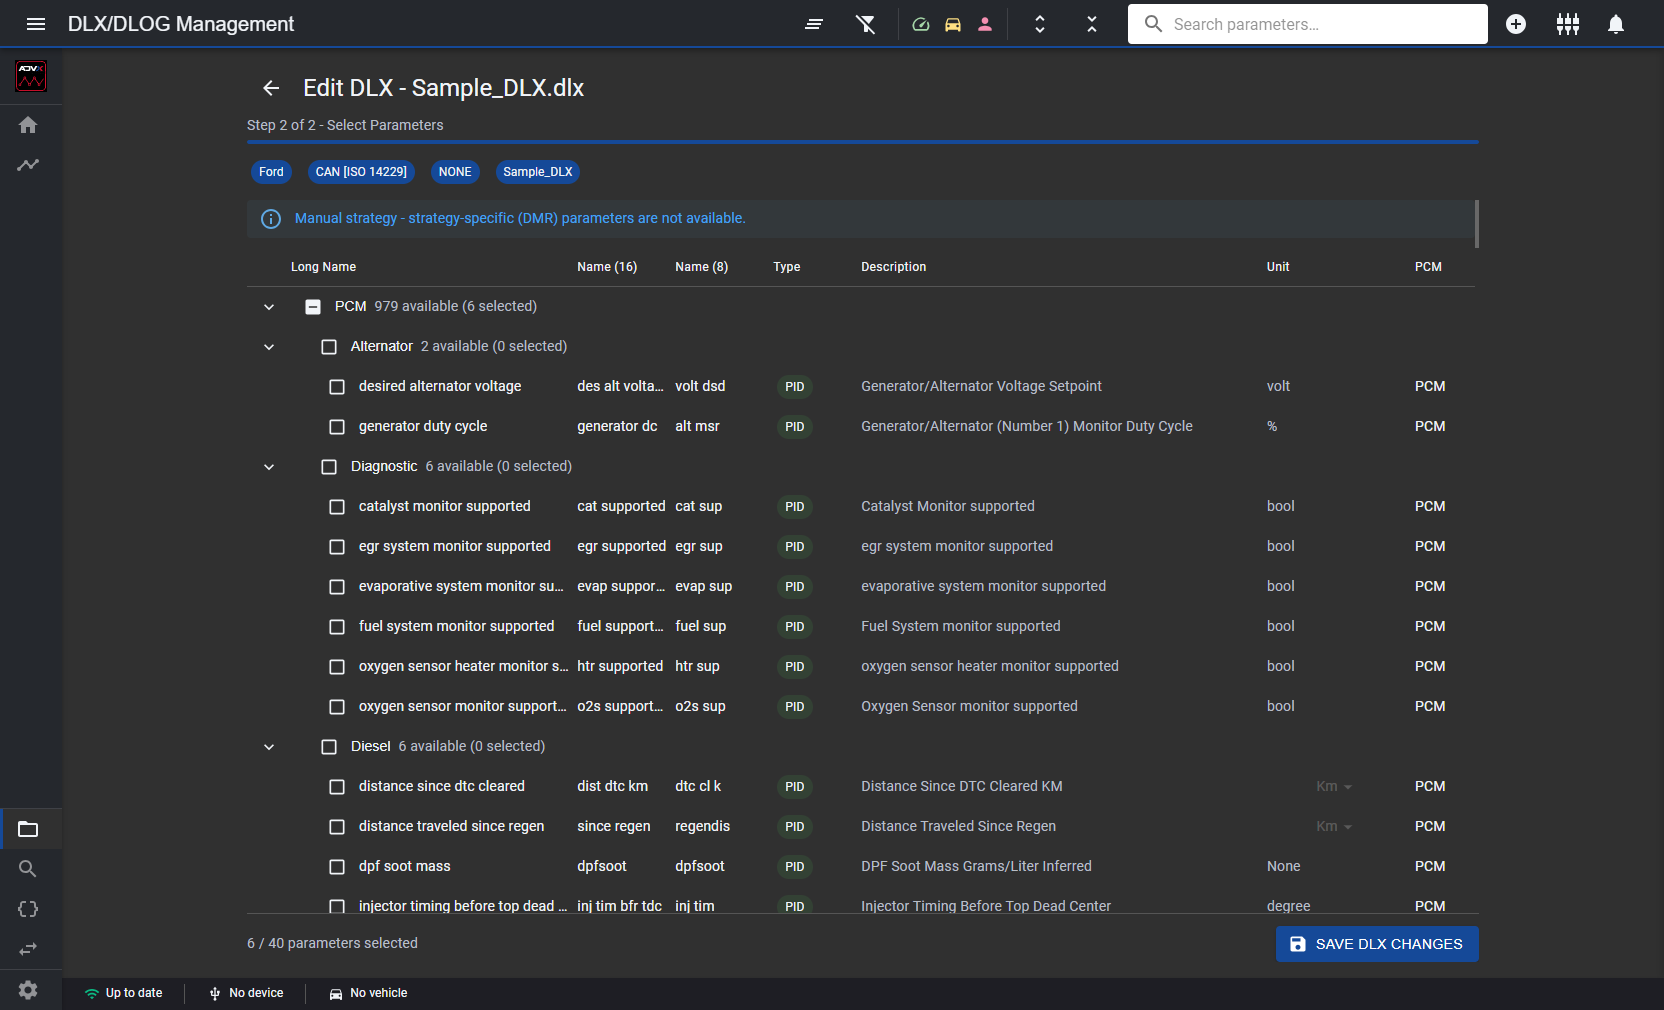 Editing an existing DLX
Edit reopens the wizard headed Edit DLX — yourfile.dlx, with Manufacturer, Communication and Description already filled. Step 2 comes back with your saved ticks intact and counted, and its button reads SAVE DLX CHANGES.
11. The reference tools
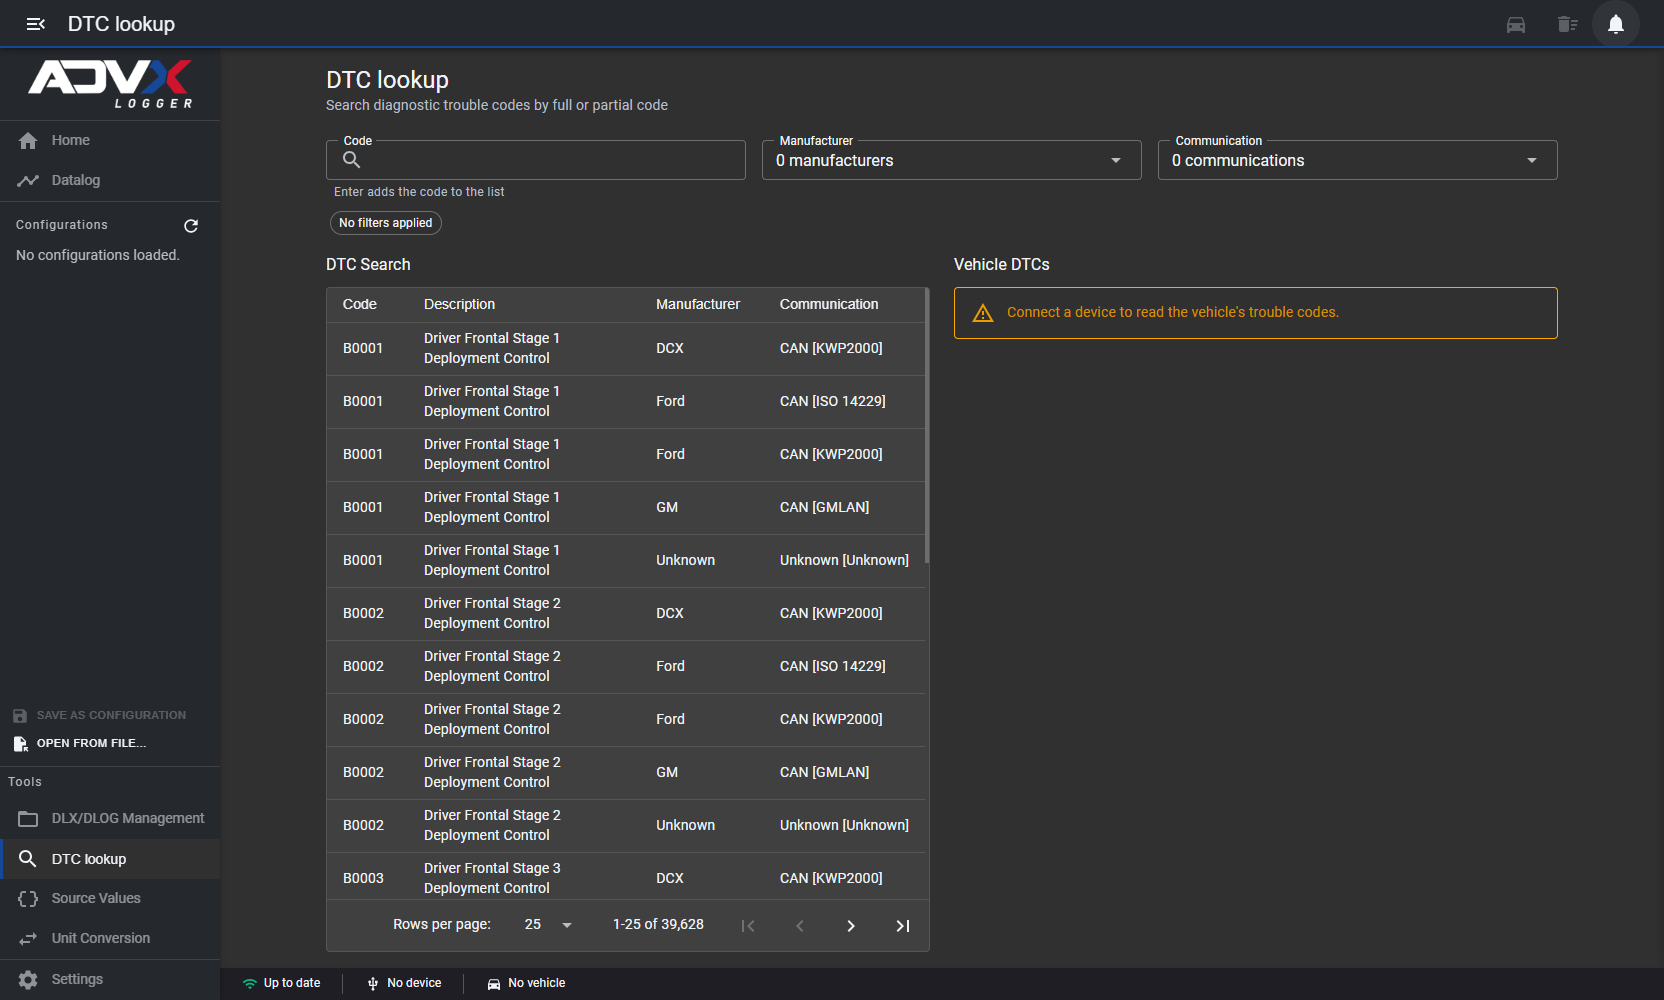 DTC lookup
 searches the trouble-code reference by full or partial code, filtered by manufacturer and protocol. The same code appears once per manufacturer/protocol pair, so P0300 returns five rows.
The right-hand pane reads codes off the car and needs a device connected.
Caution: Clear DTCs writes to the vehicle and will clear any active codes on it.
Two more tools sit beside it in the rail:
- Source Values decodes ECU enums. When a log says torque source = 3, it tells you that means Vehicle Speed Limit.
- Unit Conversion carries 17 calibration-focused converters, including an Air-Fuel Ratio family (AFR 14.07:1, 14.35:1, 14.64:1 and lambda) and a Load family that scales by 255 for single-byte ECU load.
12. Settings worth a look on day one
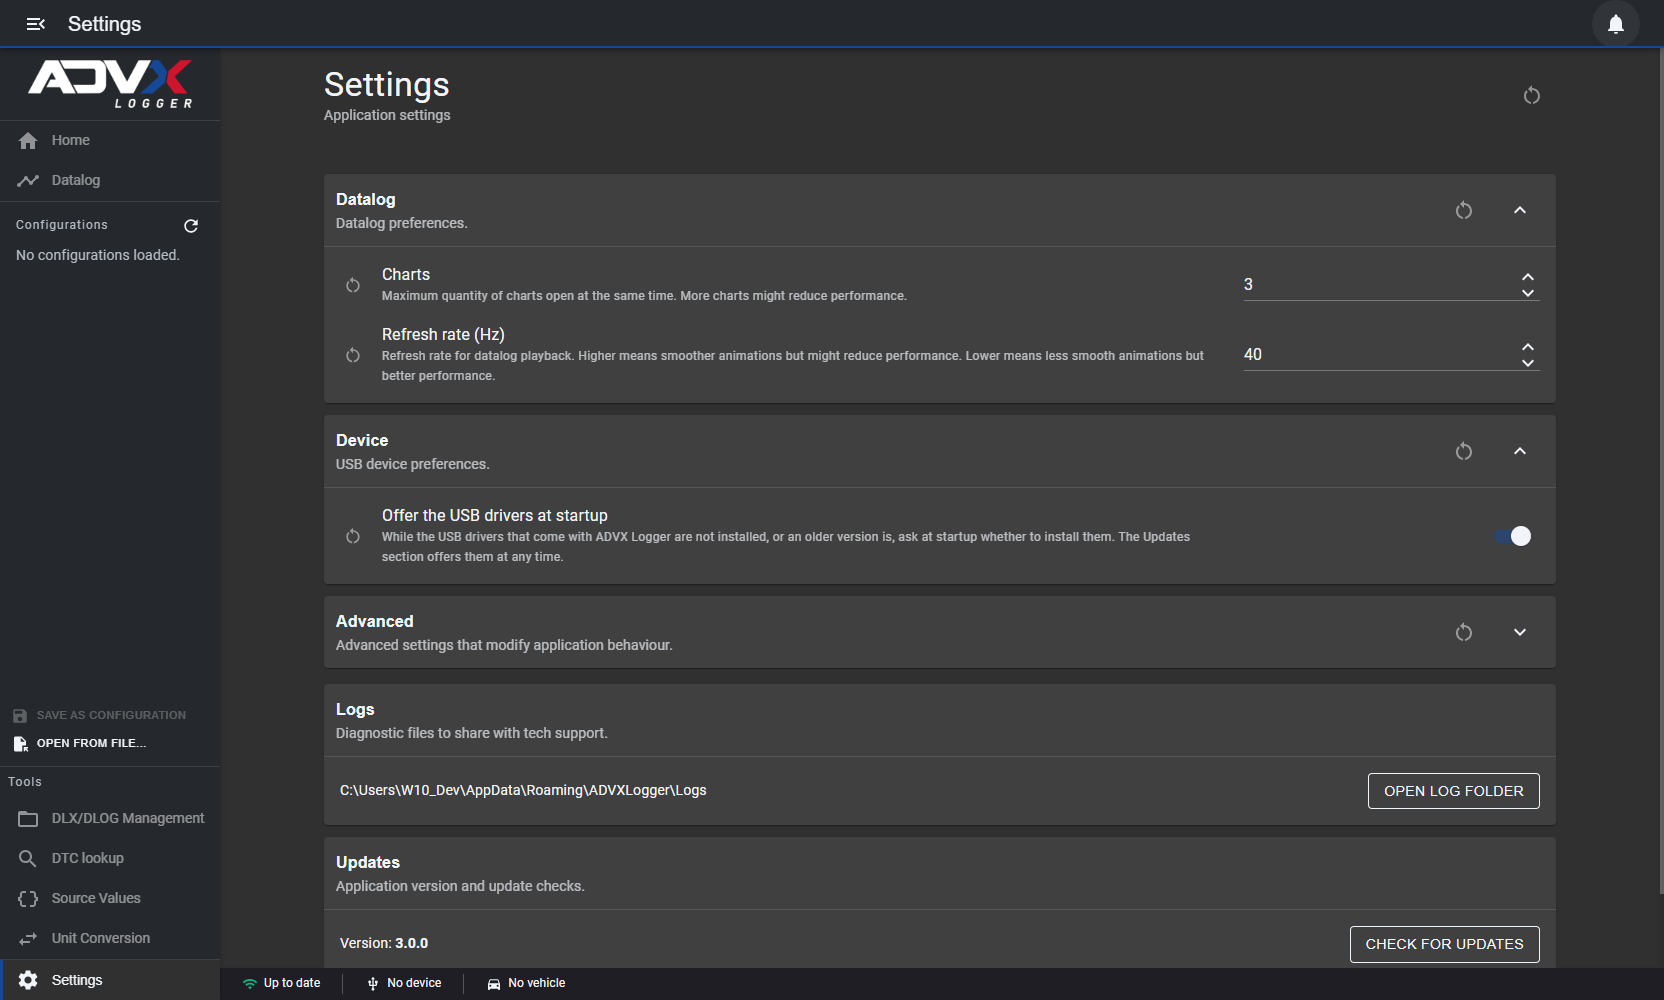 Settings
| Setting | Default | Why you might change it |
|---|---|---|
| Charts | 3 | Lets you open more charts at once |
| Refresh rate (Hz) | 40 | Playback smoothness; 20–60 in steps of 10 |
| Offer the USB drivers at startup | On | Turn off once the drivers are installed |
| Cache Memory Size | 32 MB | Under Advanced, collapsed by default, and the one setting that needs its checkbox ticked to apply |
A note on cache: at the default 32 MB, every large definition table is skipped (for example Parameter at 355 MB, ParameterLookup at 89 MB and DmrParameter at 68 MB). Nothing breaks; the first parameter query just takes about a second instead of 30 ms. If lookups feel slow and you have memory to spare, raise this first, and tick its checkbox or the change will not apply.
Settings → Logs → OPEN LOG FOLDER is the folder to zip up when you report a problem.
13. Save the layout you just built
Once a workspace is arranged the way you like (charts, gauges, the histogram, each channel’s color and axis), SAVE AS CONFIGURATION in the expanded rail writes the whole arrangement to a .llcfg file, and OPEN FROM FILE… applies it to the next log.
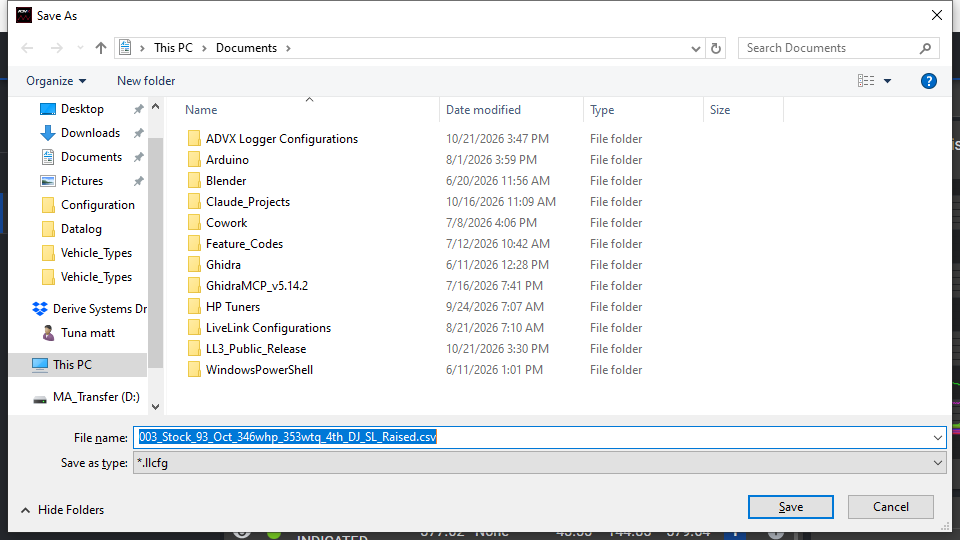 Saving a configuration
Three things to watch:
- The default filename keeps the source log’s .csv in it, so you get MyLog.csv.llcfg unless you retype it.
- The dialog opens in Documents, though the app creates a Documents\ADVX Logger Configurations folder. Step into it if you want your configurations kept together.
- Older .csv files from LiveLink 2 will not open as-is, because they are structured differently.
14. If something goes wrong
Restarting the app fixes almost everything here.
| What you see | What to do |
|---|---|
| ADD greyed out on a new histogram | Type the bin edges into Labels, or click AUTO to fill them in automatically |
| SELECT PARAMETERS greyed out | Type a Description |
| A new tile is tiny | Drag its bottom-right corner; the handle only shows while the pointer is over the tile |
| A yellow bar at the bottom, Configurations gone, pages frozen | Restart the app |
If an error shows a reference, note it down with as much detail as you can, and send that day’s log from Settings → Logs → OPEN LOG FOLDER to our tech support team.